Y2Y Interactive Map
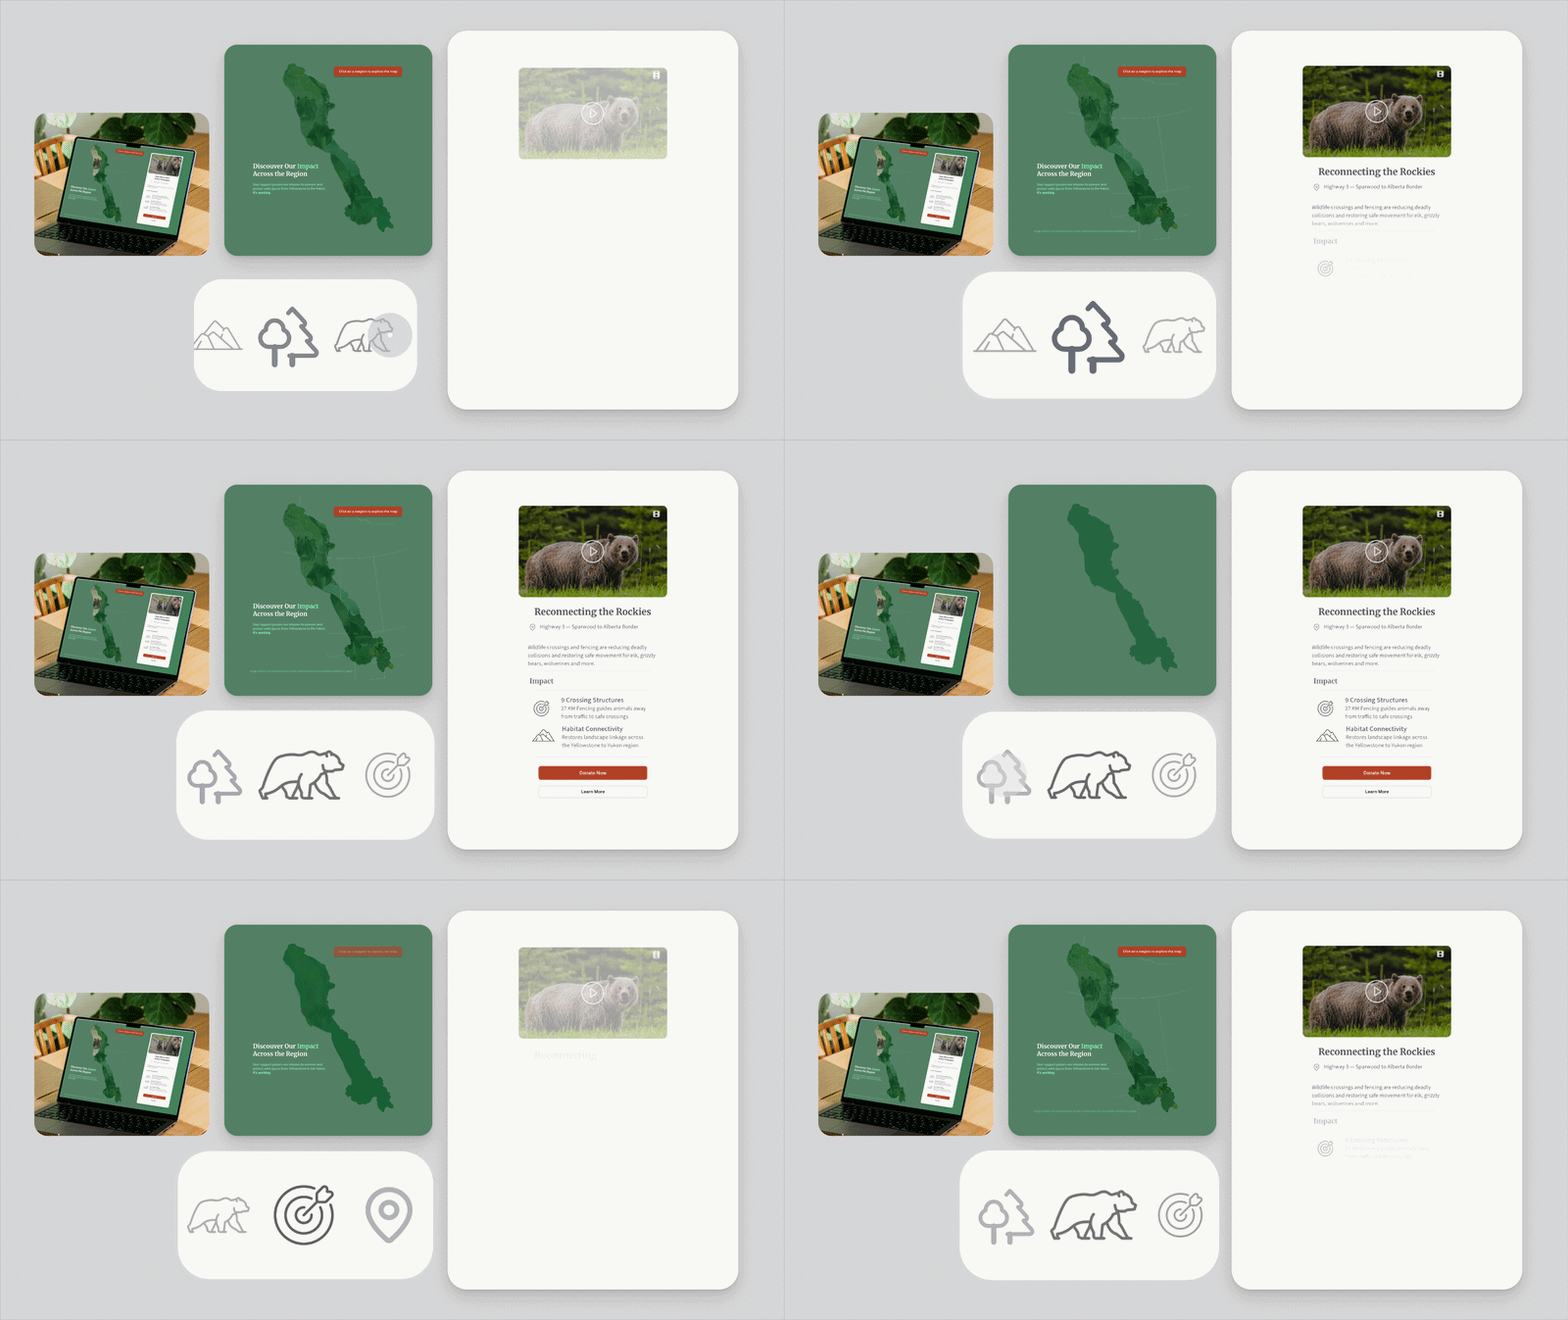


Redesign of the Y2Y (Yellowstone to Yukon, a nonprofit protecting one of the world's last great wildlife corridors) interactive map to transform it from a buried feature into a donation conversion hub. The challenge was simple but critical: users didn't know the map existed, didn't understand how to use it, and dropped off before reaching donation pages.
Key insight: The map wasn't a navigation problem. It was a visibility problem.
The Problem
-
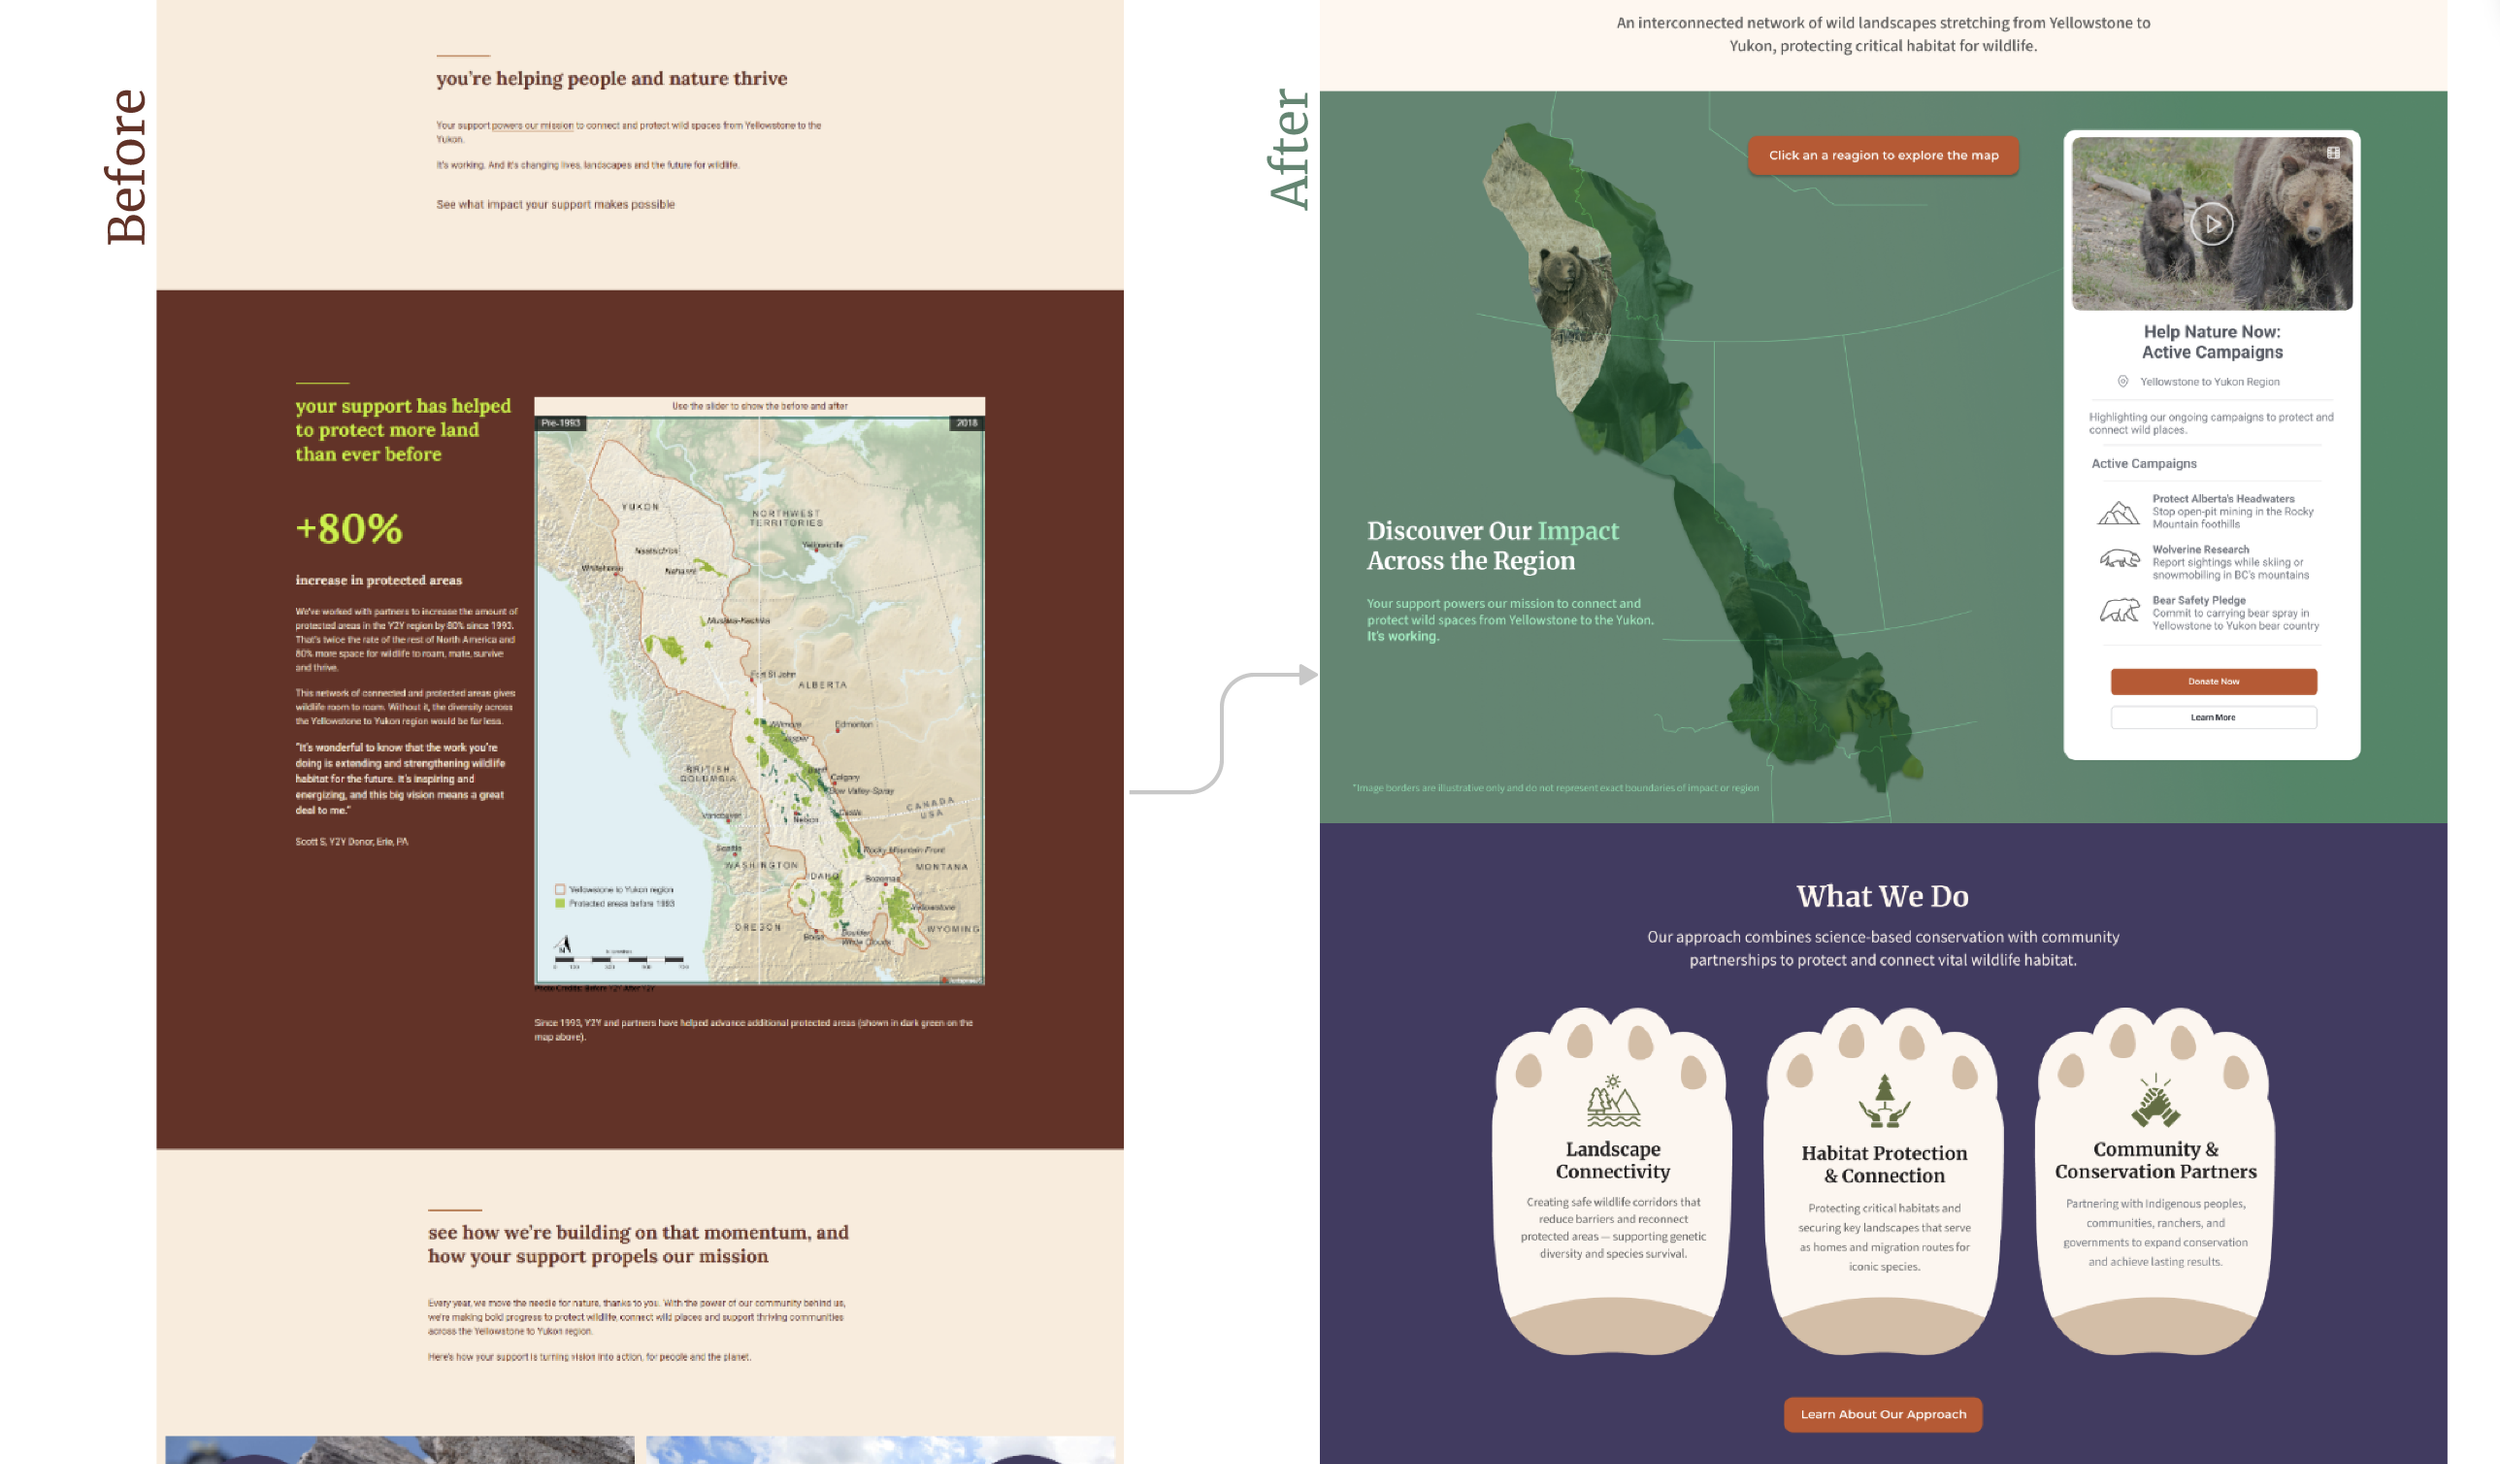
The Y2Y conservation region spans 3.2 million square kilometers, but the existing map communicated neither the scope of the organization's work nor the possibility of interaction. Users passively scrolled past it without engaging.
Metrics that revealed the issue:
67% bounce rate on the map page (vs. 38% site average)
Average time on map: 8 seconds
Less than 12% of map visitors progressed to donation pages
User interviews showed zero awareness that the map was clickable
Research validated the core problem: Users couldn't see themselves as part of an exploration experience, and the path to donation felt disconnected from the content.
Reasearch & Design
-
Round 1: Lo-Fi Testing (Interaction Discovery)
I tested an early version with 8 users and asked them to explore regions and identify what was interactive. Results were stark:
7 of 8 users did not attempt to click the map
Most hovered passively and scrolled away within 15 seconds
Users described the map as "informational but not interactive"
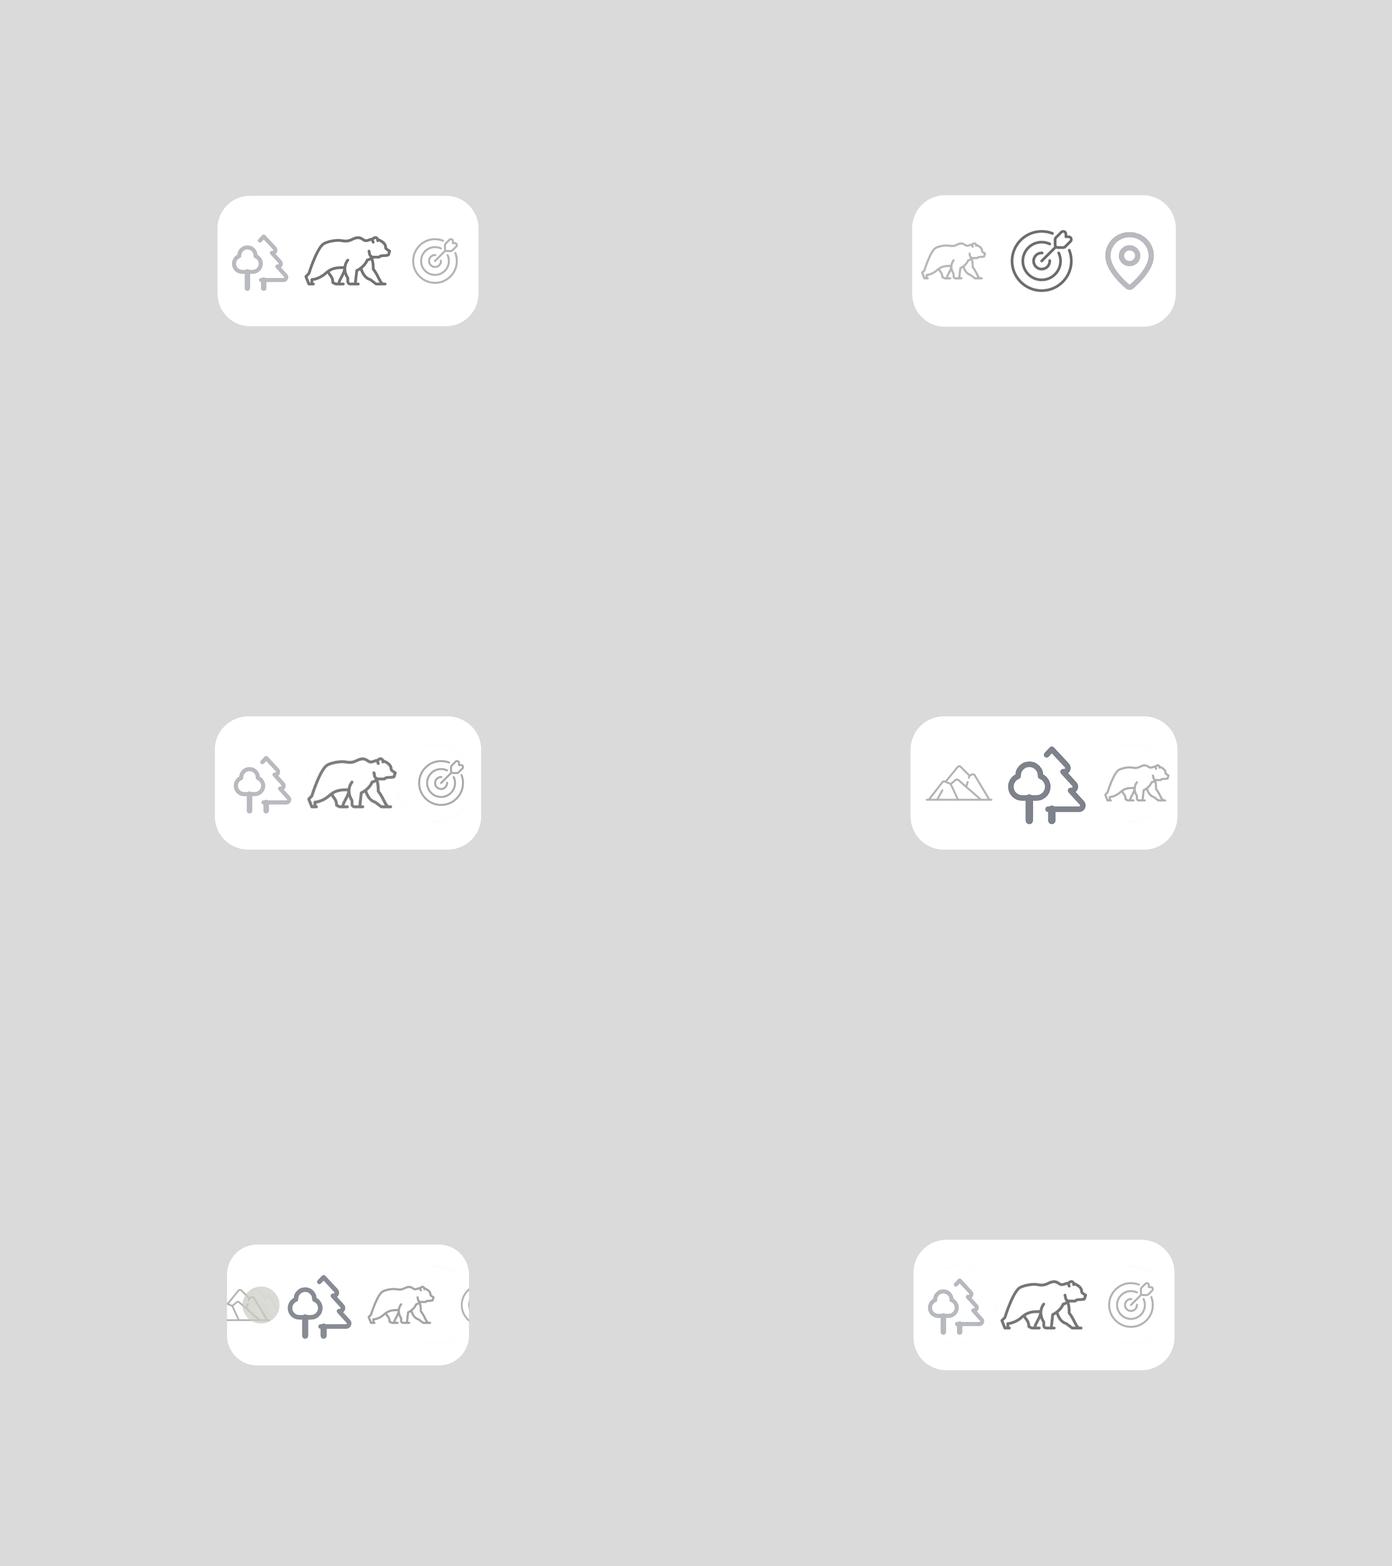
This led to introducing visual affordances: pulsing markers, high-contrast hotspots, and animated entry points that made interaction impossible to miss rather than optional to discover.
Round 2: Hi-Fi Testing (Scale Perception & Navigation Clarity)
The refined version tested equally well for interaction discovery, but revealed a secondary issue: users still underestimated the region's scale before engaging. I added clean linework showing regional borders and contextual labels, creating geographic orientation before they dived deeper.
Additionally, I mapped the user journey from map exploration to donation:
Reduced clicks to reach donation content from 4 to 2
Embedded YouTube content inside the map so exploration felt connected to real conservation work
Created breadcrumb-style navigation back to donation calls-to-action
Round 3: Final Validation
8 users completed both exploration and donation tasks without prompting. Key findings:
100% recognized the map as interactive
Time spent on map increased to 3-4 minutes (a 25-40x improvement)
68% progressed to donation pages (vs. 12% before)
Users specifically noted that embedded video content made the geography "come alive"
Test Round 1
Testers were asked to complete two tasks: explore a region on the map and identify what they could interact with. The lo-fi tests revealed immediately that users didn't recognize the map as clickable, most hovered over it passively and moved on. This drove the decision to add pulsing interaction cues and high-contrast entry points directly on the map.Test Round 2
A second round confirmed the new affordances were working, but showed users were still underestimating the region's scale before engaging. We introduced simple linework of the regions boarders to the detailed map, giving users a sense of geography and scope first.Users completed both tasks without prompting in the final round, and several noted that the embedded YouTube content inside the map was the moment the region "came alive" for them connecting the geography to real conservation work in a way the original map never had.

Solution
-
Instead of assuming users would discover interactive elements, I made discovery the default. Pulsing markers, animated hover states, and clear visual hierarchy transformed the map from a passive infographic into an active exploration tool.
Connecting Geography to Action
The redesigned map became an interconnected hub with:
Embedded video content showing real conservation work across regions
Direct pathways to donation pages for each region
Educational resources accessible without leaving the map
Clear visual indicators showing what each click would reveal
Reducing Navigation Friction
I eliminated drop-off points by creating a linear but flexible journey: discover region → watch conservation story → donate. This simplified the path while maintaining exploration freedom.
-
Conversion Impact
Map-to-donation conversion increased from 12% to 68% (467% improvement)
Average clicks to reach donation content reduced from 4 to 2
Time spent on map increased from 8 seconds to 3-4 minutes
Bounce rate on map page dropped from 67% to 19%
User Experience Impact
100% of test users recognized the map as interactive (vs. 12% in baseline)
Users completed tasks without guidance
Qualitative feedback shifted from "map felt like a dead end" to "this made the conservation work real"
Site-Wide Impact
The map became the organization's primary storytelling hub, driving traffic to linked resources and increasing overall site engagement by 34%.Key Takeaway
Users won't explore what they don't know exists. Making interaction unmissable wasn't decoration, it was the strategic difference between a feature people scrolled past and one that moved them toward the organization's mission.
Feel free to adjust the metrics to match your actual data, and let me know if you'd like me to adjust the tone or add/remove any sections!